
Harnessing the power of machine learning
One of Bonial’s biggest strengths is the excellent relationship with its clients. The first step of building a sustainable and robust foundation with a potential customer is to lay out the platform’s capacities by estimating likely volumes for each product while paying attention to neither over- nor underdelivering. So far, Bonial has achieved that by using historical data, domain knowledge, and intuition, but only until now! To infuse traffic forecasts with a scientific foundation and reduce manual work, the utilization of machine learning methods became inevitable.
In this article, you will learn about:
- Steps of data science
- Construction of datasets
- Feature engineering
- Selection & evaluation of algorithms
- Deployment of a machine learning model in a web environment
Learning and future outlook
The odyssey of developing a web application
For the sake of simplicity, we will focus on brochure clicks as the showcased product. The first task was to create the “ultimate dataset” – the trade-off was to have maximum prediction performance and minimum model complexity. Another goal was to incorporate all external factors influencing traffic and build the model so that users can apply it for all possible future use cases. It is worth mentioning that constructing a suitable set of data usually makes up the most significant part of the data science cycle because it requires a lot of domain knowledge, problem understanding, and business context application.
The initial dataset is relatively “simple” and consists of eight standard dimensions. Building upon that, we iteratively enrich it with more and more features until we reach what we think is the maximum – and now has 42! Next, we apply feature engineering and basically “go backward again” by either discarding dimensions that are not deemed relevant anymore or aggregating them.
The feature engineering process’s main idea is to replace non-informational features in the dataset like id, zip number, or calendar date with numerical representations of those.
![]()
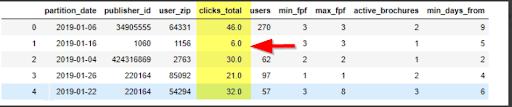
Image 1: First draft: fpf = front page factor defines the position of the brochure on the platform; active_brochures: how many brochures are concurrently active from the same publisher; min_days_from: how many days have passed since publishing the brochure
The ID of the publisher was replaced by the number of corresponding favorite-tickers the users set to receive notifications of new content from this publisher.
The 5-digit zip code would be useless for the algorithm, but the number of monthly active users in this region or this area’s population will deliver useful information for the model.
For an algorithm, the data type “date” is challenging to interpret, which is why we extract the month and weekday:

To train a machine learning algorithm, we split the data into a train and a test set. Since we are dealing with a time series-like problem, it is best practice to divide by a time component – in our case, the month – to avoid data leakage.
Mean encoding is an advanced technique of feature engineering and is applied after the train-test-split. The idea is to describe a categorical feature with the mean of the target. It is essential to strike a healthy balance in order not to risk overfitting the training data:
![]()
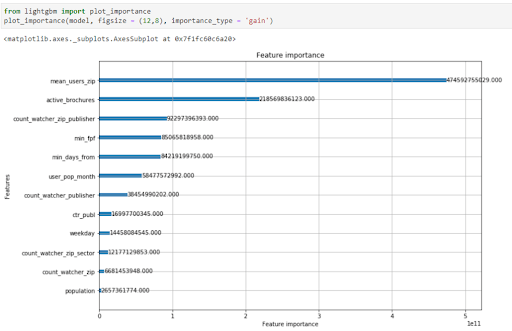
Image 2: This graph shows the importance of the selected features concerning the target variable; as expected, the mean-encoded feature has the highest importance
After applying all the steps, the final format consists of roughly 20 million rows for the train and one million rows for the test set, and 12 columns dating back to January 2019 until today.
When selecting the algorithm, one must understand that the no free lunch theorem applies: there is no single best option. It is crucial to find the optimal balance between performance, robustness to outliers, and generalizing existing patterns. Taking those conditions into account, we narrowed down the existing classes of algorithms to gradient boosted trees, and, ultimately, LightGBM emerged victoriously.
Finally, we conduct extensive hyperparameter fine-tuning until we are satisfied with the performance.
Now to the deployment:
What if I told you that you could avoid all of this and create a visually pleasing app right from your script? Streamlit allows just that! You could add cache, interactive widgets for user input, nicely looking output, and so much more with just a few lines of code, forgetting about CSS. Streamlit is a perfect tool to efficiently deploy machine learning models into production for non-web-developers while focusing and strengthening your core expertise – but that does not mean that you can completely circumvent coding. ^_~
For example, to add a drop-down menu, only one line of code is required:
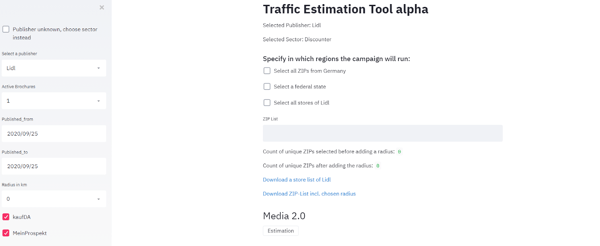
Image 3: Here, the user inputs the parameters for the estimation process
So what will the future hold for Bonial?
Bonial’s vision is to strive in the tech-department by employing cutting-edge technology. Streamlit, in combination with machine learning, can be one of the stepping stones in achieving that goal. By enhancing processes with scientific principles, we believe Bonial can become even more data-driven, efficient, and effective in supporting its stakeholders in making decisions.
Authors

This article was co-written by Michael Gabriel, a Data Analyst at Bonial.

This article was co-written by Alexander Staubmann, a Data Analyst at Bonial.