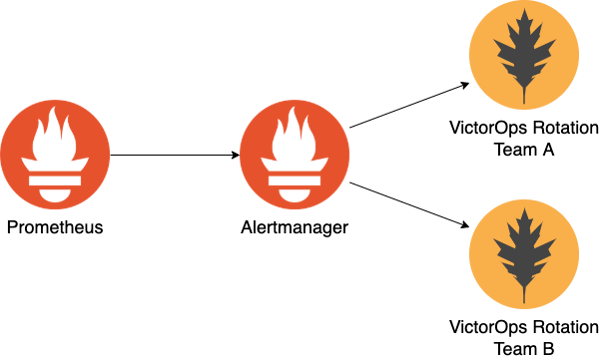
At Bonial, work is usually organized by business domains and brands. As a result, Kubernetes clusters may contain many apps owned by different teams. For monitoring, we use Prometheus, Alertmanager, and VictorOps. How do we go about routing alerts to the teams owning the apps and Kubernetes resources that produced them? This article will share the idea behind our solution.
Background
Our development teams are on-call for their apps and the underlying infrastructure (you build it, you run it). In environments like Kubernetes the underlying infrastructure is shared if you are supporting multi-tenancy. In our case this means that our operations team is responsible for all core cluster components that we deploy for each cluster, like node groups, control plane, logging, and monitoring. Prometheus alerts produced by those are pushed into the ops on-call rotation. We want to set up our alerting configuration for any other apps to figure out which team should be paged automatically.
Labeling resources
The first requirement for correct alert routing is that any Kubernetes resource that enters a cluster is labeled with a team. We are ensuring this using two approaches that complement each other. Firstly, we are enforcing the usage of a custom monochart (here’s an example, but not ours), which will automatically add required labels to all Kubernetes resources rendered from it. This has the benefit that developers cannot forget to label their apps appropriately. Secondly, we deploy a custom admission controller into every cluster, which rejects resources that do not match our labeling requirements.
Now that we have a team label attached to every resource, we can use it for alerts. A label should be propagated to Alertmanager somehow to pick the VictorOps endpoint of the responsible team dynamically.
Propagating resource labels through Prometheus
For most of the built-in resources like Deployment, Job or Pod, kube-state-metrics already provides kube_*_labels metrics which expose resource labels to Prometheus. Here is an example metric:
| kube_job_labels{endpoint=”http”,instance=”10.2.34.56:8080″,job=”kube-state-metrics”, job_name=”my-job”,label_app=”my-job”,label_team=”ops”,namespace=”default”, pod=”kube-state-metrics-7679985779-ttql5″,service=”kube-state-metrics”} 1 |
Note that this metric contains the label label_team with the value ops. This is precisely what we need. As a next step, we must attach this label information to Prometheus alerts.
Let’s take the following Prometheus alerting rule example as a starting point:
| alert: KubeJobFailed expr: kube_job_status_failed{job=”kube-state-metrics”} > 0 for: 15m labels: severity: warning annotations: message: Job / failed to complete. |
The rule will push alerts for failed Kubernetes jobs to Alertmanager. The labels of the kube_job_status_failed metric are not enough to identify the owning team. Luckily, Prometheus supports label grouping so we can modify our alerting rule to look like this:
| alert: KubeJobFailed expr: | kube_job_status_failed{job=”kube-state-metrics”} * on(job_name, namespace) group_right() kube_job_labels > 0 for: 15m labels: severity: warning annotations: message: Job / failed to complete. |
The query now “joins” the labels from the kube_job_labels metric into kube_job_status_failed using the tuple (job_name, namespace) as join key. As a result, whenever this alert fires, all job labels (including our team label) will also be forwarded to Alertmanager. Nice!
Building a VictorOps routing key from alert labels
VictorOps uses routing keys for pushing alerts into on-call rotations. At Bonial, each team has a VictorOps routing key that is just {teamname} (we also have {teamname}-day-time and {teamname}-office-hours to support different SLAs, but that’s a topic for another day). The webhook that needs to be triggered for alerting a team looks like this:
| https://alert.victorops.com/integrations/generic/20131114/alert/{apiKey}/{routingKey} |
Alertmanager has built-in support for VictorOps as a receiver; we just need to figure out how to set the routing key dynamically. Here is an example Alertmanager configuration which sets up VictorOps as a receiver:
| global: resolve_timeout: 5m victorops_api_key: ‘<your-api-key>’ route: group_by: – alertname – job – label_team – team group_wait: 30s group_interval: 5m repeat_interval: 12h receiver: victorops receivers: – name: victorops victorops_configs: – routing_key: ‘’ |
Let’s go over the interesting bits here:
- Routing is configured in a way that alerts for the same team are grouped together. The astute reader might have spotted that we are grouping by both label_team and team. We are doing this to support resource labels obtained from kube-state-metrics which are prefixed with label_ and labels that development teams set on their custom metrics to define custom alerting rules.
- The routing_key in the VictorOps receiver configuration is not hardcode. Instead, it’s built from a template that is evaluated for each alert.
Alertmanager allows defining custom templates using the Go templating language you might already be familiar with if you’re using helm. The template victorops.routing_key is one of these and looks like this:
|
catchall
|
It renders the routing key based on the presence of the team or label_team labels. If an alert is not labeled with any of these, it returns a fallback routing key to send the alert. In the example, this is just called catchall.
Putting it all together
By enforcing team labels on all resources that enter a Kubernetes cluster, we can track ownership, which allows us to make this information available to Prometheus. We updated the Prometheus alerting rule queries for Kubernetes resources to “join” the resource labels on top to propagate to Alertmanager when a given alert fires. The patched alerting rules are deployed into every cluster as part of the monitoring stack by default. Alertmanager then uses a custom template to dynamically build the VictorOps routing key for forwarding the alert into the team’s on-call rotation that takes ownership of the affected resources.
For more advanced alerting on top of custom application metrics, the team label can also be added directly to the application. Another possibility would be to automatically attach the team label to custom metrics using a ServiceMonitor. This can be extracted from the monitored pod’s or service’s labels via the podTargetLabels or targetLabels configuration field.
If you want to play around with the configuration above, check out our example repository on GitHub.
How are you handling alerting in multi-tenant environments? Drop us a line at tech-blog@bonial.com. Happy to hear your ideas!
Author

This article was written by Martin Ohmann, a System Engineer at Bonial.